Troubleshooting Azure Functions
Troubleshooting Azure Function issues related to the host runtime can sometimes be cumbersome. Having worked in support for a number of years I’ve learned a couple useful tricks. Before we start understanding the behavior of each trigger type is very important. Here’s a previous blog that I use on a daily basis as my cheat sheet for triggers.
https://blog.brooksjc.com/2019/07/31/azure-function-trigger-cheat-sheet/
Terms
There are a couple terms I’ll be using here described below:
Invocation – Single instance trigger of a specific function in the function app. Each invocation has an InvocationID value that can be used to track when it starts and if/when it completes. With application Insights, the entire lifetime of the invocation can be tracked including dependency calls.
Host Instance – Whenever the function starts up on an Instance (VM), the underlying webjob SDK starts up the host. When the host starts up it will have a unique host instance ID which can be used to track the lifetime of the host runtime. If the host instance ID changes on that specific VM, this indicates the runtime was restarted for one of various reasons.
Instance (VM) – Function apps run on underlying compute which is essentially a flavor of Azure VMs depending on the SKU (Cloud Services, VMSS, ect). The cloud_RoleInstance seen in the application Insights Logs has a unique value per instance that the app is running on. It is important to realize that the underlying host can change over time, depending on the SKU, it could change pretty often.
Where to start?
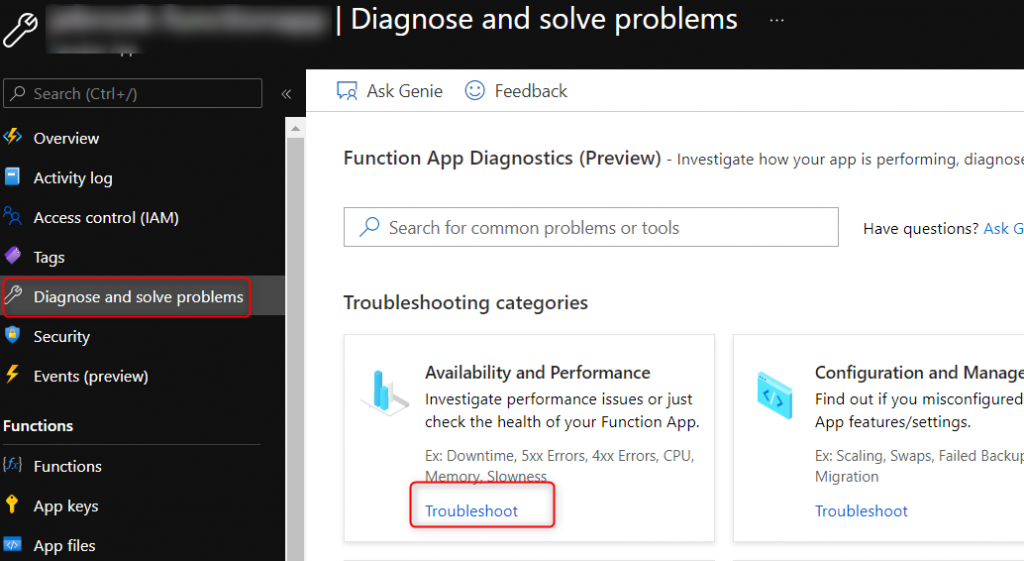
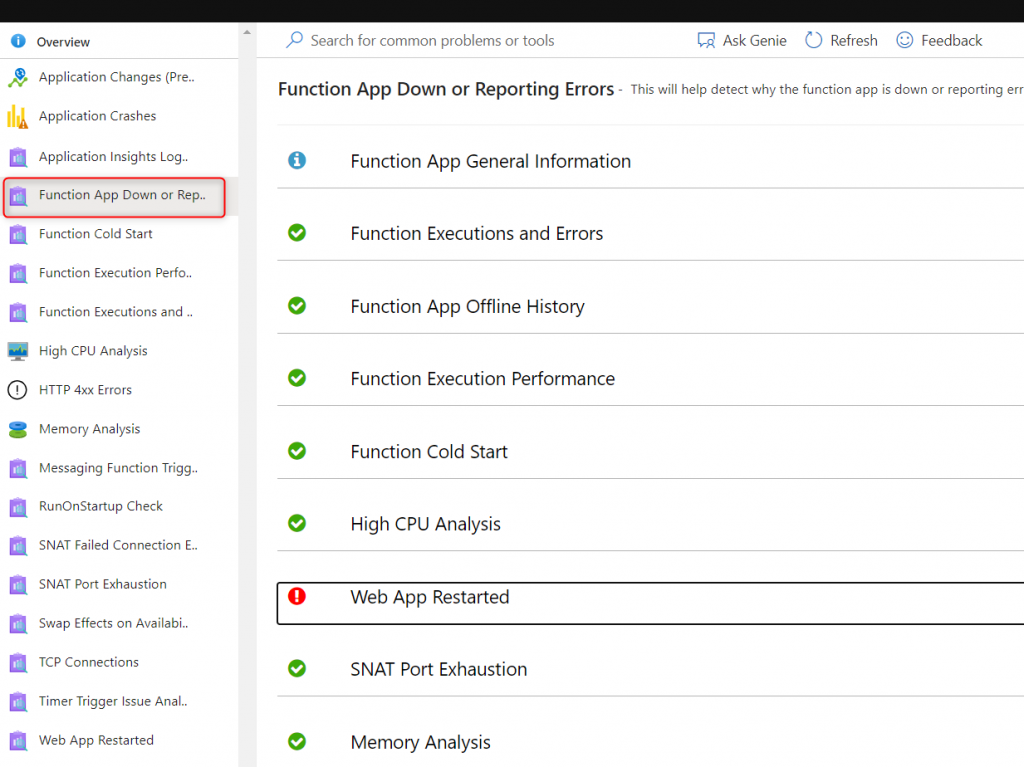
The first place to start if you are unsure how to debug an issue with your function app is under the Diagnose and Solve problems blade. The main detector that has a lot of helpful information is the Function App Down and Reporting Error detector which includes information about the functions inside the function app, an execution errors, performance information, TCP connection issues, and much more.
Application Insights
The next native solution that is typically enabled is Application Insights. There’s a lot of great detail below documented but I’ll cover briefly a couple of my go to blades. I’d recommend before an issue occurs familiarize yourself with the different blades and how Application Insights empowers you to view telemetry and data in different ways.
https://docs.microsoft.com/en-us/azure/azure-functions/functions-monitoring
https://docs.microsoft.com/en-us/azure/azure-functions/configure-monitoring?tabs=v2
https://docs.microsoft.com/en-us/azure/azure-functions/analyze-telemetry-data
- Live Metrics
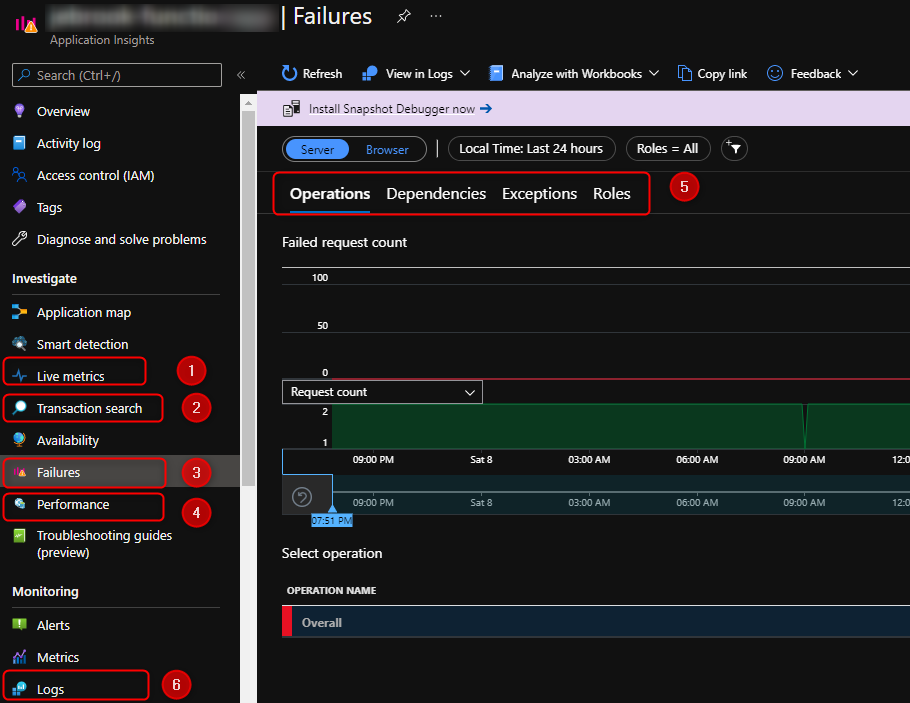
Live metrics are a nifty feature that allows you to see in near real-time incoming telemetry from the application like CPU, Memory, number of instances, exceptions, requests and incoming logs. You have roughly a 60 second rolling window. This is the place I go to validate to get an understanding of load distribution per instance, if an instance is running hot, or if there’s a lot of exceptions occurring. - Transaction search
Transaction search is global search across all the application insights tables (requests, exceptions, traces) where you can look for a key word such as exception. From there you drill into the Logs using the Kusto language. - Failures
Failures are pretty straight forward, if you’re looking for exceptions, failed invocations, failed dependency calls ect navigate to this blade. - Performance
Performance will give you a view of time taken for different types of metrics and a view of the different percentile. Here if you have enabled the snapshot debugger you’ll have the ability to view CPU profile traces to understand where time is taken in your code. - Under both the Failures and Performance blades there’s extra tabs that give you a view into additional views. The one that is often needed to debugging is outgoing dependencies such as calls to an external API, another function, or SQL. You can quickly identify if a certain upstream service is the cause of a performance degradation or exception.
- Logs
The last tab that I cover is the Logs blade. This will take you to the view similar to what you’ll see with Azure Monitor Logs view where you can run queries based on the Kusto query language. All the data discussed above is able to be accessed on this blade using Kusto queries. I cover some potentially helpful queries below.
Troubleshooting Queries via the Logs Blade
Number of Invocations
View the number of invocations per instance (VM), HostInstance, and function. This can help confirm if there is an even distribution of invocations across the number of instances that you have running for certain types of triggers such as Azure Storage Queues, Azure Servicebus, or Azure blobs. When dealing with triggers such as timers, Azure Eventhub or Cosmos DB you have to take into consideration how these triggers behave when factoring in timer functions running as singletons or Eventhub/Cosmos using partitions.
//view number invocations per instance overtime
traces
| where operation_Name != ""
| summarize count() by bin(timestamp, 10m), cloud_RoleInstance, operation_Name, appName
//| render timechart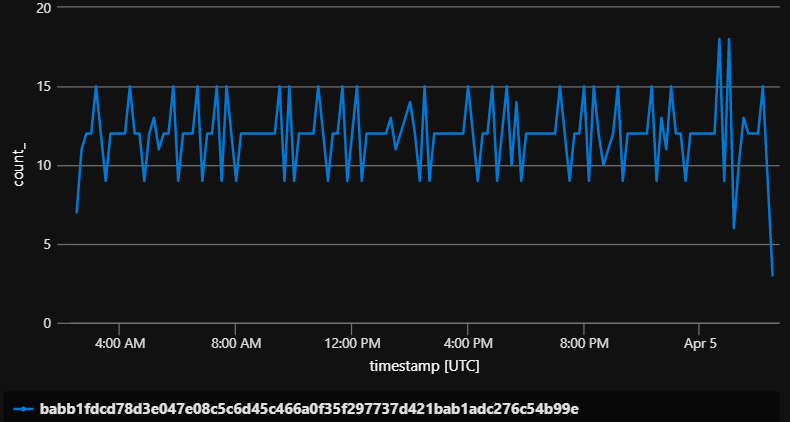
Summarize the number of Instances
This is one way to monitor how your function apps (especially in the Elastic Premium plan or Consumption plan) are scaling. When trying to understand if your function app is scaling properly keep in mind that a function app in the consumption plan may not scale to 100 instances simply because there’s 100 messages that appear in the queue. See the document below for a quick overview.
https://docs.microsoft.com/en-us/azure/azure-functions/event-driven-scaling#runtime-scaling
//summarize number of instances
traces
| summarize by bin(timestamp, 10m), cloud_RoleInstance
| summarize count() by bin(timestamp, 10m)
| render timechart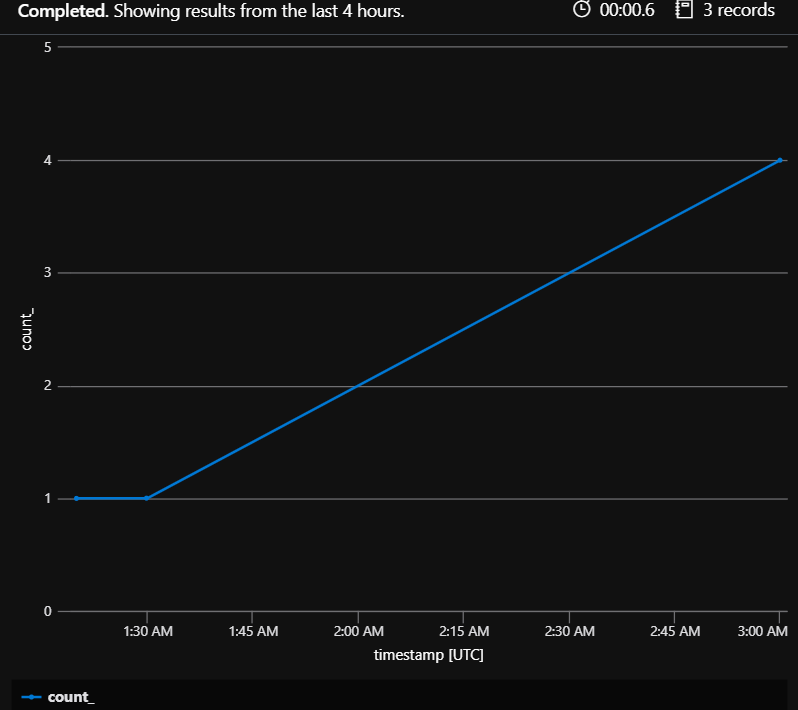
Evaluating if the Host Instance restarted
When debugging issues with triggers such as a timer trigger that didn’t complete its often very helpful to understand if there was a restart or termination of the host instance. The first query below gives you a timeline of all the host instances per VM. If the host instance ID changes for a particular cloud_RoleInstance that means it was restarted for some reason. Again this is not always unexpected but is very helpful in understanding why a specific invocation did not complete.
//Evaluate if the host restarted on a specific instance
traces
| extend HostInstanceId_ = tostring(customDimensions.HostInstanceId)
| extend ProccessID_ = tostring(customDimensions.ProcessId)
| summarize count() by bin(timestamp, 10m), HostInstanceId_, cloud_RoleInstance, ProccessID_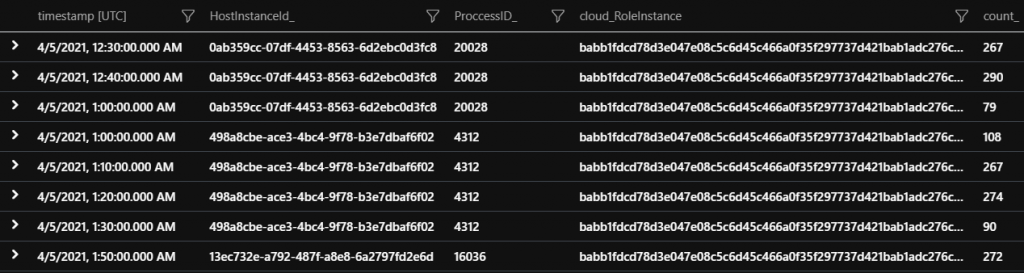
Here’s another query that specifically shows when the job host starts and stops. If you are seeing these entries in the logs its an indication that the function app is gracefully being shutdown for a reason such as platform update, the function app has no further work to execute at that point in time, or a file has been changed in the wwwroot directory causing the host to recycle, just to name a few. If you do not see these entries its possible the function app has crashed. In Windows, if this is the case, review the eventlog.xml file in the home/Logfiles/eventlog.xml or under Diagnose and Solve Problems -> Event Log to see if there is a unhandled exception that caused the function app to crash.
//Job Host start and stopped actions - Understand what the host runtime is doing
traces
| extend HostInstanceId_ = tostring(customDimensions.HostInstanceId)
| where customDimensions.Category == "Microsoft.Azure.WebJobs.Hosting.JobHostService"
| project timestamp, message, operation_Name, cloud_RoleInstance, HostInstanceId_, appName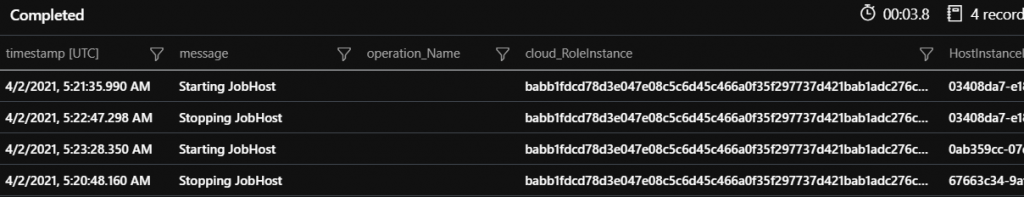
What Functions are Indexed
When the runtime starts up it indexes (loads) the functions that it is able to find and logs these entries out. Also the logging level is shown. This can be helpful in scenarios where a specific function is not triggering and can be used to confirm if the runtime actually is aware.
//What functions were indexed and logging level
traces
| where timestamp > ago(5d)
| extend HostInstanceId_ = tostring(customDimensions.HostInstanceId)
| where message contains "Found the following" or message contains "LoggerFilterOptions"
| project timestamp, message, operation_Name, cloud_RoleInstance, HostInstanceId_, appName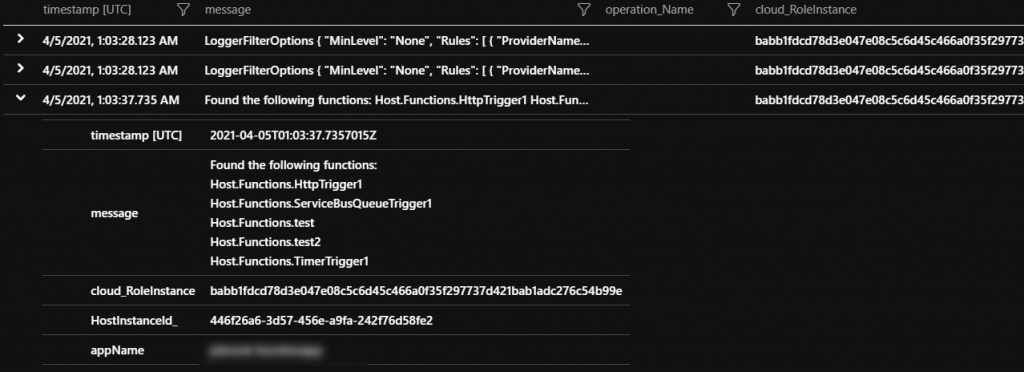
Function Listeners Failing to start
Some function triggers poll the event source while others keep track of the next execution like timers. If the “listener” for the specific execution is failing to start then the function will not execute. The query below can be used to see if any functions are in this state.
Timer triggers – check if the storage account associated with the AzureWebJobsStorage app setting is accessible, has the right key, or is blocked by Network restrictions being enabled.
Eventhub – same as the storage account information mentioned above as well as the Eventhub connection string information being correct
Most other triggers – Confirm that the connectionstring is correctly configured.
//Function failing to startup since the host runtime not being able to pull metadata like communicating with storage
traces
| where customDimensions.["prop__{OriginalFormat}"] contains "Retrying to start listener for function" or customDimensions.["prop__{OriginalFormat}"] contains "The listener for function"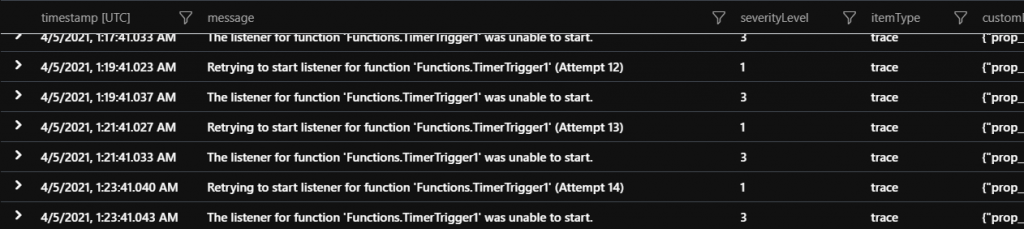
Function Invocations not completing (failure or success)
An often difficult scenario to debug is understanding if a specific invocation completed. This is often the case for timer triggers that have very long execution times and you are unable to see if the invocation is still running or if it started but never completed due to one of the many reasons that the host instance was restarted or the function app crashed. From the query below you can confirm which instance the invocation started on and the host instance ID. From this information you’ll be on step closer to confirming if the invocation is still running or if the host instance terminated.
**Note – Its always recommended to have a configured invocation timeout limit rather than leaving it unbound. For V2+ functions all SKUs have a default timeout. For V1 functions on any of the dedicated SKUs the timeout is by default unbound. This can be changed in the host.json.
//incomplete functions for example the function app is terminated unexpectedly ect
traces
| where operation_Name != ""
| extend delta = iff(message has "Function started" or message has "Executing", 1, 0)
| where delta == 1
| extend HostInstanceId_ = tostring(customDimensions.HostInstanceId)
| extend ProccessID_ = tostring(customDimensions.ProcessId)
| extend InvocationID_ = tostring(customDimensions.InvocationId)
| summarize by timestamp, HostInstanceId_, cloud_RoleInstance, ProccessID_, InvocationID_, operation_Name
| join kind = leftanti (traces
    | where operation_Name != ""
    | where message has "Executed" or message has "Function Completed"
    | extend InvocationID_ = tostring(customDimensions.InvocationId)
    | project timestamp, message, InvocationID_)
on InvocationID_
| summarize FirstOccurrence=min(timestamp) by InvocationID_, operation_Name, cloud_RoleInstance, HostInstanceId_, ProccessID_
| project FirstOccurrence, InvocationID_, operation_Name, cloud_RoleInstance,HostInstanceId_, ProccessID_